


- With a 4% loss, Starknet has pushed the price to $0.059.
- STRK’s downtrend puts the sellers in firm control.
While the wider market attempts a recovery, Starknet (STRK) changes hands around $0.05962 following a sharp 4% reduction in value. The current chart has not yet flashed a definitive recovery pattern, meaning the next direction relies on whether buyers can protect support and build upward momentum.
A sustained move higher could reinforce the recovery and clear a path upward. The token’s 24-hour window spans from $0.05851 to $0.06474, while its seven-day corridor ranges between $0.05851 and $0.1073. Meanwhile, daily trading volume has hit $100.259 million.
On the 4-hour timeframe, Starknet reveals a negative outlook characterized by successive red candlesticks. The asset could potentially slide toward the primary support level at $0.058. As bears gather further strength, a death cross could materialize, potentially driving the price down to previous lows under $0.05754.
If a market reversal occurs for Starknet, bulls could step in and push the token back toward the resistance area near $0.060. Continued upward pressure might spark a golden cross, gradually encouraging the price to climb higher toward the $0.06155 mark.
Can Starknet Momentum Flip Its Bearish Streak?
Examining STRK’s technical charts closely, the Moving Average Convergence Divergence (MACD) line rests beneath the signal line, with both positioned below the zero threshold. This configuration highlights robust, accelerating bearish momentum and a dominant downtrend where sellers maintain firm command.
This shift in momentum indicates that recent downward pressure is intensifying, raising the probability of short-term price declines. It represents a textbook bearish configuration implying that the downtrend is actively persisting rather than fading, leading traders to avoid buying and instead wait for a bullish crossover.
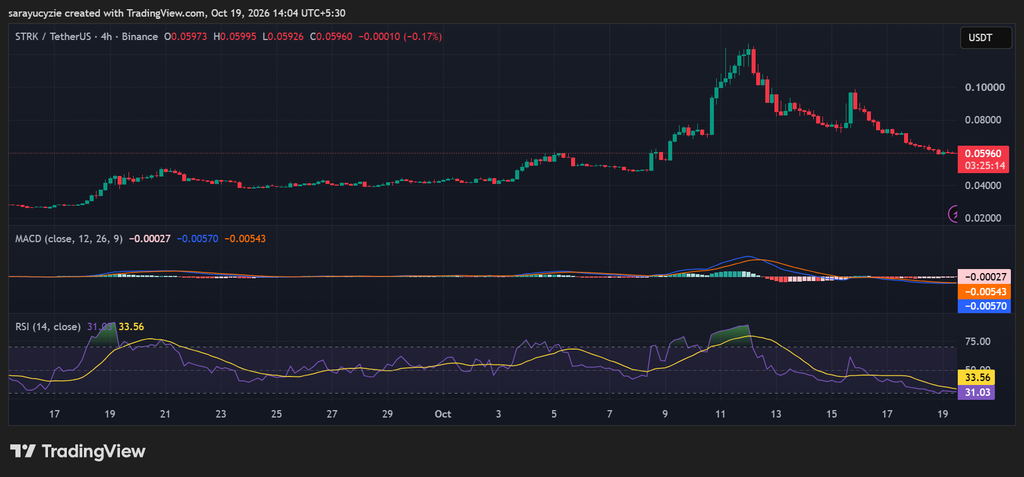
Additionally, Starknet’s daily Relative Strength Index (RSI) registers at 31.03, placing it right on the boundary of oversold territory. Intense selling pressure has fueled severe recent price contractions, with sellers keeping a tight grip on the market.
Although this downward momentum could eventually exhaust itself and increase the chances of a price bounce, assets can remain oversold for extended periods during intense downtrends. Consequently, traders keep an eye out for a bullish crossover back over 30 or a bullish divergence.
Crypto Market Highlights
1,404 Qubic Wallets Face Security Fallout After 2.94 Trillion QU Drain
Frequently Asked Questions
What is the current trading price of Starknet (STRK)?
Starknet is trading around $0.05962 following a 4% decline.
What are the key support and resistance levels for STRK?
The nearest support zone sits at $0.058, with potential drops below $0.05754 if a death cross occurs. On the upside, resistance is found around $0.060, with a potential target of $0.06155 if bulls trigger a golden cross.
What do the technical indicators say about Starknet’s momentum?
The MACD line sits below the signal line and the zero line, signaling strong bearish momentum. Furthermore, the daily RSI reading is at 31.03, putting the asset on the edge of oversold territory.
