


- Bitcoin (BTC) is currently trading at the $81.5K mark.
- Strong bearish momentum is seen in an established downtrend.
The leading cryptocurrency, Bitcoin (BTC), currently changes hands at $81,502, having registered a 24-hour span between $80,760 and $82,816. Furthermore, its seven-day spectrum ranges from $79,805 to $84,231, while the token’s trading volume stands at $25.82 billion.
Additionally, BTC displays a recurring accumulation signal amid its lackluster price action. The chart clearly highlights bearish momentum; after dipping beneath $80,000, buyers stepped in to push the asset back toward the $82,000 territory to reestablish stability.
The $83,000 area serves as a major resistance level that BTC has been unable to recapture, with sellers successfully defending it during every test. A confirmed, steady recovery remains unlikely until the price breaks above this threshold and holds it on the 4-hour chart. Notably, a rejection at $81,200 could pave the way for a descent toward the $80,000 level.
The Bitcoin Price Levels and Technical Momentum Trajectory
To trigger further upward movement, BTC must break past the $81,647 resistance barrier. A definitive 4-hour close above this point sets the next target at $82,000 or higher. Meanwhile, a descending trendline near $80,000 has been tested and continues to function as a robust barrier. Conversely, slipping beneath the $81,000 zone would significantly weaken the chart’s outlook. Should the price fall past $79,680, attention will shift to the $78,000–$76,000 range, where the next critical support lies.
Technical analysis of the chart indicates that the Moving Average Convergence Divergence (MACD) line is positioned beneath the signal line. Because both lines reside below the zero threshold, they point to powerful bearish momentum within an ongoing downtrend.
The position below the zero line validates the broader downward market trend. Meanwhile, dropping underneath the signal line suggests that short-term selling pressure is accelerating, thereby intensifying the negative momentum. This configuration functions as a sell signal, implying that the asset is likely to challenge lower support floors.
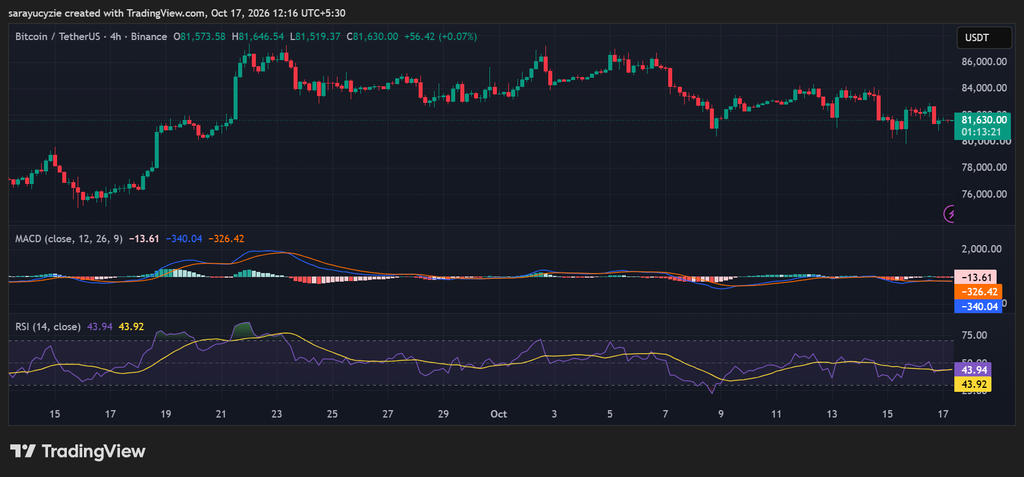
Moreover, the daily Relative Strength Index (RSI) registers at 43.94, pointing to mild bearish momentum and light selling pressure while staying generally neutral. Remaining under the midpoint of 50 shows that sellers hold a slight advantage over buyers at present.
Because it has not breached the 30 level, the token is not yet categorized as oversold. A further descent toward 30 would indicate growing selling pressure, whereas a rebound past 50 would show that buyers are taking charge once again.
Crypto Market Highlights
Price Momentum: Ethereum (ETH) Sweeps the Lows and Roars Back to $2.4K
Frequently Asked Questions
What is the current trading price of Bitcoin (BTC)?
Bitcoin (BTC) is trading around the $81.5K mark, specifically at $81,502, with a 24-hour range between $80,760 and $82,816.
What are the key resistance and support levels to watch for Bitcoin?
Significant resistance is found near $81,647 and the $83,000 zone. On the downside, crucial support levels include the $80,000 mark, a descending trendline near $80K, and a vital support range between $78,000 and $76,000 if the price drops below $79,680.
What do the technical indicators say about BTC’s momentum?
The MACD line is sitting below the signal line and beneath the zero line, signaling strong bearish momentum and a sell signal. Additionally, the daily RSI sits at 43.94, showing mild bearish pressure while remaining in neutral territory below the 50 mark.
