


- SUI is currently trading at $1.00.
- The price is testing lower support levels.
Market sentiment is reflected by widespread red across the charts. As the bear grip tightens, digital asset momentum continues to fade. SUI stands out among altcoins after posting a 4% decline in value.
Currently changing hands at $1.00, SUI has recorded a trading volume of $832.436 million. Over the past 24 hours, the token has fluctuated between $0.9956 and $1.06, while its seven-day span ranges from $0.9609 to $1.14.
Driven by bearish momentum, SUI faces the threat of additional losses and is likely to slide toward a key support level at $0.88. A strong downside correction could prompt a death cross, potentially pushing the asset back to retest previous lows in the $0.70 range or lower.
Conversely, a market reversal could encourage buyers to step in, allowing the price to climb toward the closest resistance near $1.12. Should upward pressure prove sufficiently resilient, a golden cross could materialize, eventually propelling the price past the $1.20 milestone.
Momentum Appears Weak on SUI’s Technical Chart
The Moving Average Convergence Divergence (MACD) line rests below the signal line, with both positioned underneath the zero line. This crossover points to robust bearish momentum within an ongoing downtrend, while remaining below zero validates the prevailing negative market direction.
Dropping beneath the signal line demonstrates that short-term selling pressure is intensifying, which further amplifies negative momentum. This configuration typically functions as a short signal, suggesting SUI will likely keep falling or test lower support boundaries.
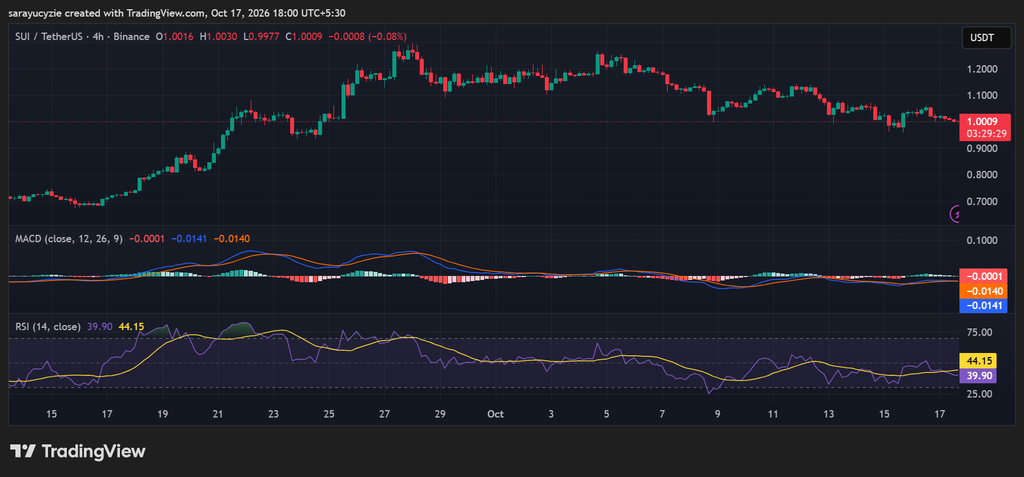
Additionally, the daily Relative Strength Index (RSI) stands at 39.90, pointing to moderate bearish momentum where sellers maintain the upper hand, though the asset has not yet entered oversold territory. Remaining beneath the 50 baseline shows that selling pressure presently outpaces buying demand.
While selling weakness is evident, the indicator stays above the 30 threshold, meaning the asset is not yet technically oversold. A drop under 30 would point to an intense wave of selling, whereas a rebound above 45–50 would signal that SUI’s selling pressure is subsiding.
Crypto Market Highlights
Bitcoin (BTC) Price Under Pressure as Bears Tighten Their Grip Amid Persistent Downtrend
Frequently Asked Questions
What is the current trading price of SUI?
SUI is currently trading at $1.00, following a 4% decline in value.
What are the key support and resistance levels for SUI?
Key support is anticipated at $0.88, with potential further drops toward the $0.70 range if a death cross occurs. On the upside, the nearest resistance sits around $1.12, with a potential push above $1.20 if a golden cross emerges.
What do the technical indicators say about SUI’s momentum?
The MACD line is positioned below the signal line and the zero line, indicating strong bearish momentum. Meanwhile, the daily RSI reading of 39.90 reflects moderate selling pressure while remaining just above oversold territory.
