


- Ethereum (ETH) rebounds following a low sweep, climbing back to $2.4K as buyers re-enter the market.
- While momentum is gaining traction, the overall direction stays unclear as the asset consolidates.
Leading altcoin Ethereum (ETH) currently changes hands at $2,483, marking a 3.3% increase alongside a total volume of $14.28 billion. Throughout the 24-hour trading session, the price dropped to a low of $2,324, clearing out stop-losses positioned under $2,350 before staging a recovery. Furthermore, total liquidations over the past 24 hours reached $93.31 million.
A swift reclaim following a sweep of the lows points to underlying resilience rather than genuine selling pressure. ETH has climbed back above the $2,440 zone, with a potential bullish divergence taking shape. Previous resistance has converted into support, and a rising trendline continues to provide a floor for the price.
Ethereum’s current price momentum could push it toward the $2.5K resistance zone. Should it achieve a further upside breakout, bulls could spark a golden cross. This development might progressively lift the cryptocurrency’s price past $2,584.
Conversely, if sellers take control of the ETH market, immediate support rests near the $2.3K mark. If this downward correction gathers momentum, a death cross could materialize, potentially allowing bears to pull the price down further.
Technical Analysis: Bullish Momentum Builds for Ethereum
An examination of Ethereum’s four-hour chart shows the Moving Average Convergence Divergence (MACD) line moving above the signal line. With both indicators positioned below the zero line, a shift toward bullish momentum is signaled within the context of a broader downtrend.
This upward crossover suggests that short-term buying pressure is picking up speed, hinting at the beginning of a potential price rebound or reversal. Because the lines remain under the zero line, the overarching trend continues to be downward. Market participants often treat this setup as an early indication to ready themselves for a buy signal, waiting for the lines to move above the zero line to validate a full uptrend.
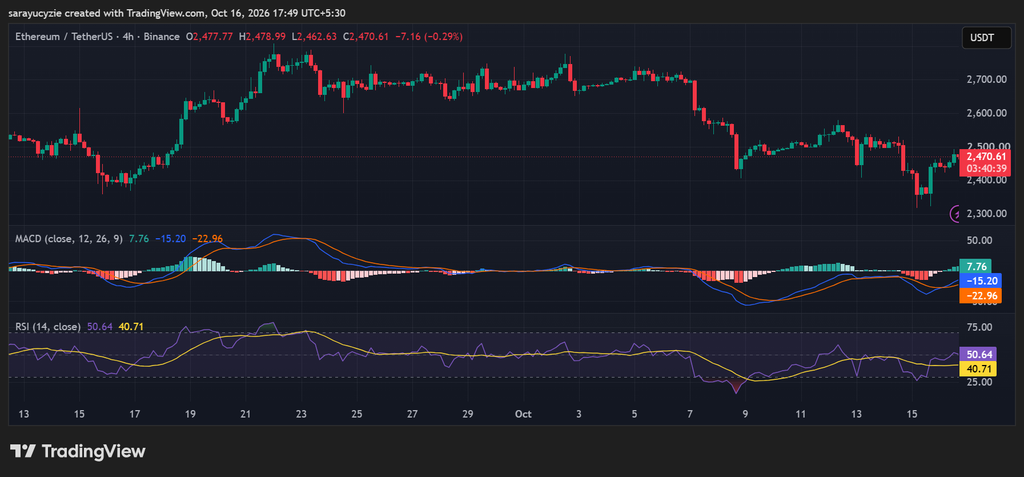
Additionally, the daily Relative Strength Index (RSI) sits at 50.64, pointing to a neutral and balanced market devoid of a dominant directional bias. Hovering right at the midpoint of 50, buyers and sellers exhibit equal strength, leaving Ethereum’s price in a state of consolidation while awaiting a market catalyst.
The asset rests comfortably away from extreme thresholds, where readings above 70 indicate overbought conditions and levels below 30 point to oversold territory. A move past 55 would indicate that bullish momentum is gaining control, whereas a decline beneath 45 would point to mounting bearish pressure.
Crypto Market Highlights
Coinbase and Kalshi Hit With Access Restrictions in Taiwan Over Election Betting
Frequently Asked Questions
What is Ethereum’s current trading price and volume?
Ethereum is trading at $2,483, reflecting a 3.3% increase, with a settled volume of $14.28 billion.
What key support and resistance levels are traders watching for ETH?
Immediate resistance is located around the $2.5K level, with a potential path toward $2,584 if broken. On the downside, immediate support is found near $2.3K.
What do the technical indicators say about Ethereum’s current trend?
The four-hour MACD has crossed above the signal line below zero, signaling short-term bullish momentum within a broader downtrend. Meanwhile, the daily RSI sits at 50.64, showing a neutral, consolidating market.
