


- Celestia (TIA) moved near $0.75 following the introduction of Eden and a wider altcoin market recovery.
- The four-hour technical chart continues to show bullish momentum, though an RSI reading near 68.51 points to an increasing likelihood of a market correction.
Even as Bitcoin pulled back to $81K, Celestia’s TIA token pushed its upward movement forward on October 17, advancing toward $0.75 as market participants reacted to the rollout of Eden—an experimental blockchain created to evaluate how autonomous AI agents execute payments and trade on-chain. TIA changed hands around $0.717 during the time of writing, following a peak near $0.76.
This upward push comes on the heels of a significant daily surge on October 16, when past market figures indicate TIA jumped approximately 16.5% during the session. Furthermore, the token has drawn strength from a resurgence of interest across altcoins.
Eden functions as an Ethereum-compatible network developed with the Evolve stack, utilizing Celestia for data availability. Revealed on October 16, the network acts as a testing ground for “agentic commerce,” allowing artificial intelligence agents to trade, conduct transactions, and fund model usage directly on-chain.
Botfun, the ecosystem’s inaugural experiment, permits participating agents to generate and exchange tokens, with payments for model inference managed via the x402 protocol. Because TIA serves as the gas token for Eden, the rollout establishes a direct utility link to the asset.
TIA Tests Resistance as Four-Hour Momentum Remains Positive
Data from Binance’s four-hour TIA/USDT chart highlights TIA breaking past its preceding consolidation zone near $0.60 prior to heading toward $0.75. At the most recent price point of $0.717, the asset stayed positioned above both displayed moving averages: roughly $0.6904 for the faster average and about $0.6146 for the slower one. While recent candles display some profit-taking following the peak price, this alignment underpins the ongoing upward trend.
Meanwhile, the Relative Strength Index (RSI) hovered close to 68.51 on the graph, nearing the traditional overbought boundary of 70. This reflects robust buying pressure while simultaneously leaving the door open for short-term retracements.
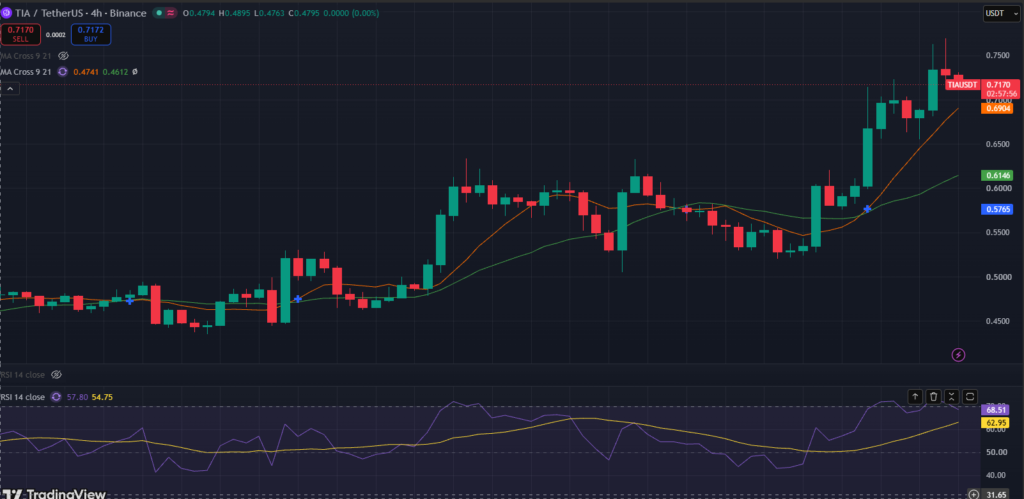
Traders are keeping a close eye on the 0.75–0.76 band as immediate resistance. A decisive breakout above this ceiling could propel the rally further, whereas a pullback might pivot attention toward 0.69–0.70 as a nearby support floor. Should selling intensity pick up, the 0.61–0.62 zone acts as a deeper reference level.
Even with the favorable market momentum, Eden is still in an experimental phase, meaning its long-term impact on overall TIA demand remains unproven.
Frequently Asked Questions
What caused the recent Celestia (TIA) price rally?
TIA’s price climbed toward $0.75 driven by a broader altcoin market rally and the introduction of Eden, an experimental EVM blockchain designed to test AI agent payments and on-chain trading.
What is Eden?
Eden is a high-performance, Ethereum-compatible experimental blockchain built using the Evolve stack and powered by Celestia for data availability. It acts as a sandbox for testing agentic commerce where AI agents can transact and trade.
What is the role of TIA in the Eden network?
TIA functions as the native gas token for the Eden network, creating a direct connection between the ecosystem’s AI commerce experiments and the token.
What are the key technical levels to watch for TIA?
Immediate resistance is situated between $0.75 and $0.76. If a pullback occurs, nearby support levels can be found around $0.69–$0.70, with a deeper support zone located at $0.61–$0.62.
