


- Bitcoin climbed back to $80,300 following a dip close to $79,200, though it continues to trade under crucial four-hour moving averages.
- The RSI sits around 42, with overhead hurdles positioned near $80,600 and $81,150, while a drop past $79,400 might trigger additional declines.
On Monday, Bitcoin bounced back toward $80,300 after sliding under the $80,000 threshold, though its four-hour timeframe still displays underlying weakness. This upward correction comes after multiple sessions of downward pressure that dragged BTC down from peaks above $84,000 the previous week.
During the reporting period, the Binance four-hour chart indicated that the BTC/USDT pair traded at $80,303.61. Although the asset recovered from an immediate low around $79,200, it stayed underneath both the nine-period and 21-period moving averages. Furthermore, broader market statistics pegged Bitcoin close to $80,400 on Oct 26, spanning an intraday band of roughly $79,278 to $80,839.
BTC Faces Resistance as Momentum Remains Weak
Market data reveals that Bitcoin’s downward slide gained steam once prices neared $84,800. Successive red candles subsequently forced BTC down toward $79,200, with bears driving the downward action. Recent green candles point to a recovery effort, yet the asset has not yet formed a definitive bullish pattern.
The moving averages represent a significant obstacle for bulls. The indicators position the nine-period average near $80,585 and the 21-period average close to $81,152. Because Bitcoin trades beneath these markers, short-term momentum appears constrained. Surpassing $80,600 would signal early improvement, whereas a firm breakout past $81,150 would indicate that buyers are stepping back into the driver’s seat.
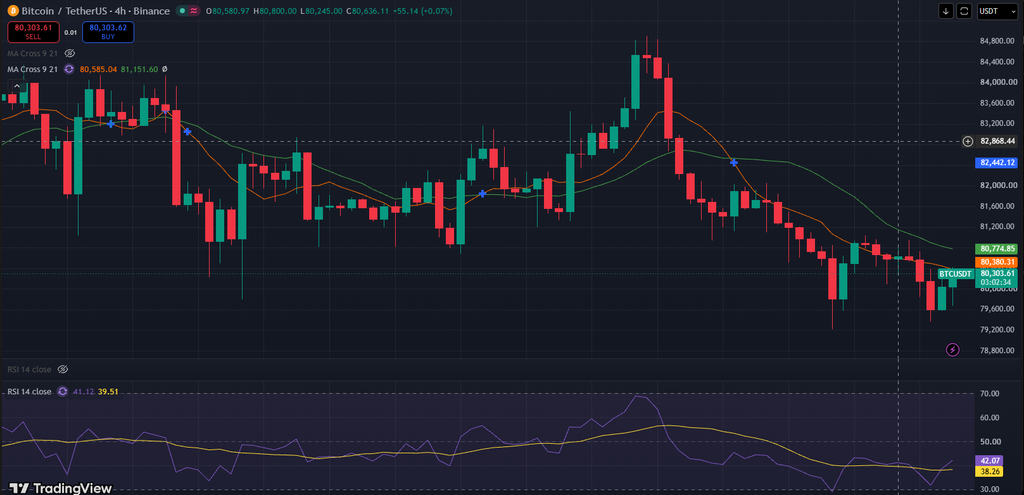
Meanwhile, the Relative Strength Index (RSI) registers near 42. Sitting under the neutral 50 line, the metric shows that bears maintain control. Even so, since the RSI rests above the standard oversold level of 30, it does not currently guarantee an imminent, powerful reversal.
Regarding support, the zone surrounding $79,400 serves as the primary level to monitor. A definitive drop below this mark could leave the $79,000 threshold—and potentially deeper floors—vulnerable to selling pressure. Conversely, if bulls successfully protect this support and push BTC past $80,600, subsequent challenges await in the $81,150 to $81,200 range.
At present, Bitcoin strives to consolidate around the $80,000 mark, though technical charts fail to confirm a definitive trend reversal. The cryptocurrency’s subsequent trajectory relies heavily on whether buyers can recapture the moving averages or if sellers force a breakdown beneath current support levels.
Frequently Asked Questions
What price did Bitcoin rebound to?
Bitcoin recovered to approximately $80,300 after dropping near $79,200.
What are the key resistance levels for Bitcoin right now?
Resistance levels are situated around $80,600 and between $81,150 and $81,200.
What does the Relative Strength Index (RSI) indicate?
The RSI stands near 42, staying below the neutral 50 mark to show that bearish momentum has the upper hand, though it is not yet in oversold territory below 30.
What downside level should traders watch?
A break below $79,400 could leave Bitcoin vulnerable to further losses toward the $79,000 region and lower.
