


- Bitcoin (BTC) is changing hands around the $82.3K level.
- Short-term momentum points upward, whereas the long-term trend remains in recovery.
Bitcoin (BTC) currently changes hands at $82,324, accompanied by a trading volume of $26.63 billion. Over the past 24 hours, the cryptocurrency has fluctuated between $80,671 and $83,035, while its weekly band spans from $79,805 to $74,074. The cryptocurrency wrapped up the week under roughly $82,500.
That threshold marked the peaks of May 2026 and acted as a vital continuation marker in early 2025, giving it dual chart importance that makes it a critical area of interest. Although the daily close above the October downtrend offered a positive technical signal, it has been immediately complicated by the weekly close beneath $82.5K.
Should Bitcoin fail to recapture that price point on lower timeframes—particularly on the daily chart—acting on the downtrend break becomes difficult. Ending the week below resistance essentially turns that former threshold into fresh resistance rather than support.
Reclaiming $82,500 would make the bearish weekly close resemble a mere shakeout. Failing to do so strips the October downtrend breakout of its significance entirely, leaving the price positioned beneath the exact level needed to validate continuation.
The previous two instances where BTC underwent such tight compression resulted in rallies from $64K to $80K, followed by a move from $76K to $86K. The short-term bias stays bearish underneath $83,400, meaning prices will likely face continued pressure inside the current range prior to the emergence of any definitive directional move.
What is Ahead for Bitcoin’s Momentum?
The Bitcoin price might test the $82,218 support if bearish pressure intensifies. A deeper downward correction could spark a death cross formation and push valuations toward $82.1K. Conversely, if BTC bulls recapture momentum, the price could advance toward the $82,401 resistance. Sustained bullish pressure might then trigger a golden cross, driving the asset past $82.5K.
The MACD line for BTC rests above the zero line while the signal line stays below it, undergoing a fast-moving bullish shift. Short-term momentum has shifted to positive as buyers assert control, while the broader, long-term trend continues recovering from a recent period of weakness or bearish action.
This divergence hints at a robust upward impulse steering the market out of a downtrend. Traders view this early-phase setup as a compelling buying opportunity ahead of the signal line catching up and crossing zero to confirm a complete trend reversal.
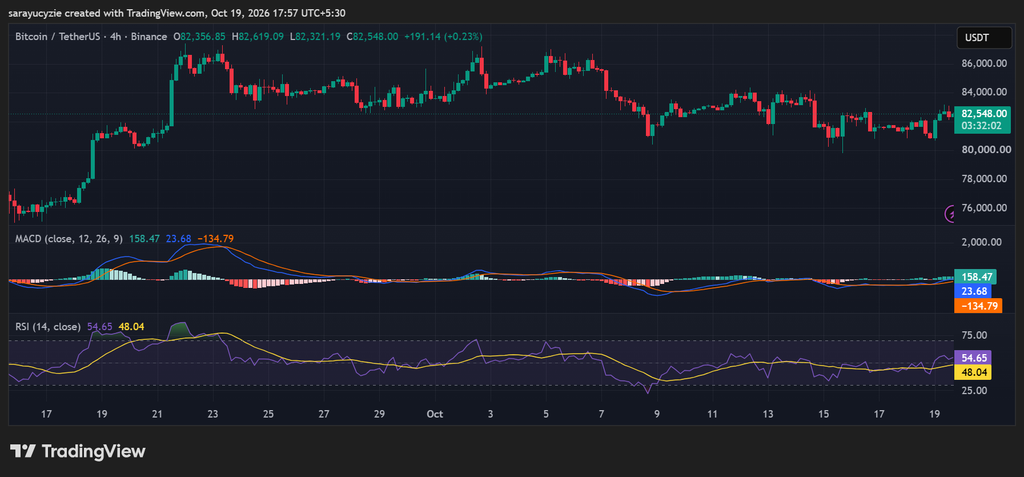
The daily RSI reading sits at 54.65, holding above the neutral 50 line to signal a mild bullish bias and slight buyer dominance. This leaves plenty of room for price action to develop in either direction. Moving past 50 implies that average gains on upward price moves are currently exceeding downward losses.
While this does not yet constitute an aggressive buy signal for Bitcoin, it points to underlying resilience and a steady upward drift. Bulls maintain a slight edge, though a move above 60 is required to signal strong, enduring momentum.
Crypto Market Highlights
Starknet (STRK) Loses Ground With a 4% Slide: Is a Trend Reversal in Sight?
Frequently Asked Questions
What was Bitcoin’s weekly close level of concern?
Bitcoin closed the week below approximately $82,500, a level that previously acted as a May 2026 high and a key continuation point in early 2025.
What do the technical indicators say about short-term momentum?
Short-term momentum is currently positive, with the daily RSI at 54.65 (above the neutral 50 line) and the MACD line sitting above the zero line, indicating a mild bullish bias and buyer control.
What needs to happen for the bearish weekly close to be dismissed?
Bitcoin must reclaim the $82,500 level. Failing to do so means the recent break of the October downtrend loses its significance, keeping the asset under pressure.
