


- Ethereum currently sits at $2.6K.
- Strong buying pressure is confirmed by ETH indicators.
Ethereum (ETH), the leading altcoin, has rallied roughly 5.6%. This marks a milestone not seen in nearly a month: closing a daily candle above $2,500. The chart now clearly displays this breakout from the sideways trading channel.
Trading presently near the $2,644 mark, the asset records a volume of $22.215 billion. Over the past 24 hours, the price moved between $2,495 and $2,652, while the weekly range spans from $2,361 to $2,652. Total market liquidations for ETH reached $135.93 million.
While the breakout is not completely validated yet, the market requires one more daily candle to close and stay above $2,500. Nonetheless, the driving momentum is difficult to ignore. The upcoming daily close will determine whether this breakout solidifies or retreats into the previous range.
Key Support and Resistance Levels of Ethereum
The closest resistance zone to monitor is $2,680. Successfully closing past that threshold brings $2,696–$2,719 into view. Following that, significant resistance lies above $2,770, with $2,800 serving as the primary milestone should the breakout persist. A prolonged push above that level paves the way toward $3K.
Regarding support, Ethereum’s immediate floor is situated near $2,586, marking the initial area buyers must protect if the upward trend slows. Breaking below this zone shifts attention back to the $2,500–$2,400 region, which acted as resistance for almost a month.
Momentum Builds for ETH as Indicators Signal Bull Control
Both the MACD and its signal lines rest above the zero line, indicating operation within a robust macro uptrend. This upper positioning points to accelerating short-term bullish momentum within the broader uptrend, with the dual-positive alignment confirming intense buying pressure.
Additionally, this demonstrates that ETH bulls maintain strict market control and actively push prices upward. Market participants interpret this setup as a high-probability buy signal for holding long positions. Even so, observers must remain vigilant for overbought signals that might indicate short-term momentum exhaustion.
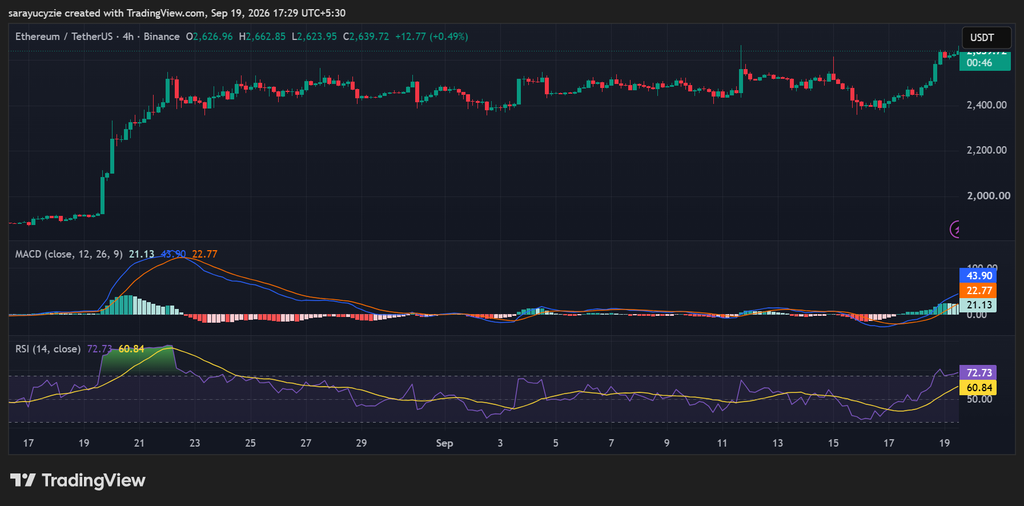
Ethereum’s daily RSI rests at 72.73, placing it firmly in overbought territory. This reflects how intensive buying momentum has driven the price upward across recent sessions. At the same time, this zone acts as an early signal that the market may be short-term overextended.
Traders receive a cue to exercise caution when initiating new long positions. Although assets can sustain overbought conditions during powerful bull runs, this high reading raises the probability of upcoming consolidation as momentum subsides.
Crypto Market Highlights
a16z-Backed Linera Shuts Down Operations as Funding Runs Dry
Frequently Asked Questions
What is Ethereum’s current price status?
Ethereum is holding around $2.6K, having recently surged roughly 5.6% and closed a daily candle above $2,500 for the first time in nearly a month.
What are the key resistance levels to watch for ETH?
The immediate resistance is at $2,680, followed by $2,696–$2,719, major resistance above $2,770, and $2,800 as the first major target on the path to $3K.
What are the crucial support levels if the market pulls back?
Ethereum’s primary support is near $2,586. If that level fails, the $2,500–$2,400 range will come back into focus.
What do the technical indicators say about market momentum?
The MACD lines are above zero, signaling strong macro and short-term bullish momentum. However, the daily RSI stands at 72.73 in overbought territory, suggesting caution for new long positions as the market may become short-term overextended.
