


- NEAR Protocol rallied by over 27%, trading at $3.46.
- NEAR’s short-term bullish momentum is accelerating.
NEAR Protocol (NEAR) currently trades near the $3.46 mark, posting a 27% increase in value alongside a volume reaching $1.916 billion. During the past 24 hours, the asset moved between a low of $2.71 and a high of $3.56 after successfully breaking through the pivotal $2.65 resistance level.
This upward push has successfully reclaimed the $3.20 region. Bulls currently maintain firm command, and strong bullish momentum persists as the price approaches the next resistance barrier.
What’s Driving the Price Move?
Two major developments accompanied the recent price activity. NEAR has rolled out confidential perpetual futures on near.com, utilizing Hyperliquid for execution. The standout feature extends beyond private positions to include private funding and wallet attribution.
Additionally, traders gain access to more than 50 perpetual contracts with up to 40x leverage, while NEAR Intents manages the funding route. This architecture makes it significantly more difficult to trace deposit activity back to a specific wallet identity—addressing the issue on transparent perpetual platforms where large wallets frequently expose trading strategies.
Furthermore, Quantus Network’s QTC is set to debut on near.com as the platform’s initial post-quantum asset, underscoring NEAR’s focus on long-term infrastructure relevance.
Co-founder Illia also reiterated the core vision for NEAR: utilizing artificial intelligence as the frontend and blockchain as the backend, with NEAR Intents already routing $30 billion across the onchain ecosystem.
NEAR’s Key Support and Resistance Levels
Support: The $3.10–$3.20 range serves as the immediate floor to watch during any retracement. Notably, the region just below the $2.85 level acts as the next vital support zone for NEAR.
Resistance: The initial resistance hurdle sits at $3.65. Beyond that, the $3.85–$4.00 zone represents the next major target if the current momentum is sustained.
NEAR Protocol Indicators Flash Strength
The Moving Average Convergence Divergence (MACD) line and its corresponding signal line for NEAR Protocol are positioned above the zero line, reflecting a robust macro uptrend. This elevated territory points to accelerating short-term bullish momentum within the ongoing uptrend.
This crossover confirms intense buying pressure, showing that buyers remain in firm control and continue pushing prices higher. Market participants generally interpret this as a high-probability buy signal. Nevertheless, because both lines reside well above zero, monitoring for potential overbought conditions remains crucial.
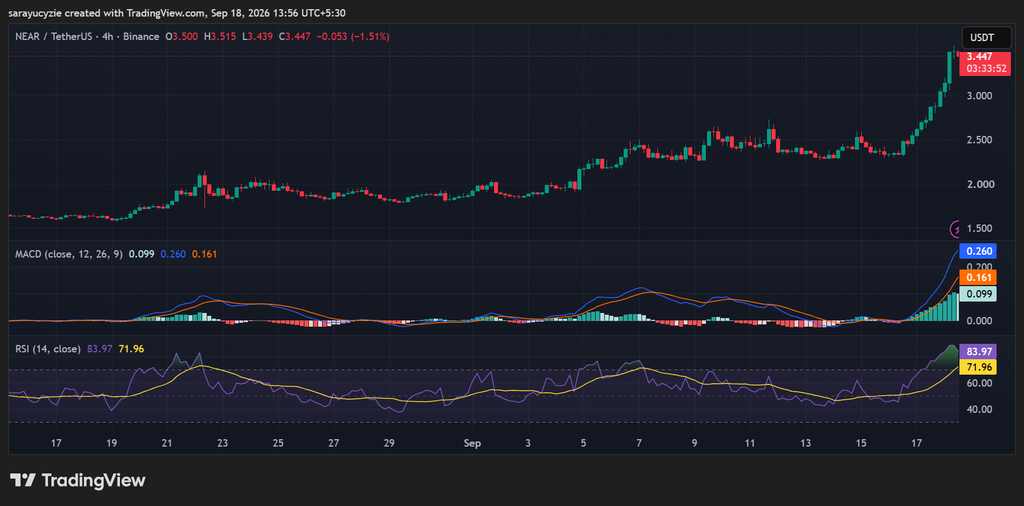
The daily Relative Strength Index (RSI) for NEAR sits at 83.97, placing market momentum squarely in extreme overbought territory. This reading indicates that buyers have fueled an exceptionally strong rally, building intense upward pressure throughout recent trading sessions.
At the same time, this indicator acts as a cautionary signal that the current move is heavily overextended in the near term. Traders regard this level as high risk for initiating new long positions. Although prices can persist in their upward trajectory during powerful rallies, this reading highlights a heightened likelihood of upcoming consolidation.
Crypto Market Highlights
SEC Opens the Door to Onchain Stocks With Five-Year Innovation Exemption
Frequently Asked Questions
What caused NEAR Protocol’s recent price rally?
NEAR Protocol surged over 27% to trade at $3.46, driven by strong ecosystem momentum, the launch of confidential perpetual futures on near.com executing on Hyperliquid, and the integration of new assets like Quantus Network’s QTC.
What are NEAR’s key support and resistance levels?
Immediate support rests between $3.10 and $3.20, with a critical secondary floor located just below $2.85. On the upside, resistance stands at $3.65, followed by a major target range between $3.85 and $4.00.
What do NEAR’s technical indicators suggest?
The MACD lines indicate strong buying pressure and accelerating short-term bullish momentum within a macro uptrend. Meanwhile, the daily RSI sits at 83.97, placing the asset in extreme overbought territory and signaling a higher probability of short-term consolidation.
