


- With a 16% rise, Arbitrum is currently trading at $0.15.
- The long-term ARB momentum has turned positive.
As of Sept. 16, Arbitrum (ARB) changes hands within the $0.1547 range, marking an increase of over 16.2% alongside a volume totaling $530.9 million. Throughout the 24-hour window, prices fluctuated between $0.1328 and $0.159—with the upper boundary representing a complex structural zone. Meanwhile, the seven-day spread spans from $0.1316 to $0.1721.
Concurrently, Standard Chartered has established a $10 price target for the cryptocurrency by the conclusion of 2030, representing a 70-fold increase relative to present values. ARB is currently pushing into a rising wedge formation. While momentum remains robust, it is also narrowing, meaning a drop beneath the lower trendline would establish a vital downside objective.
Examining the four-hour chart closely, recent bullish activity could elevate the Arbitrum price toward a peak near the $0.1599 resistance threshold. Should buying momentum gather additional strength, a golden cross could materialize and drive the asset toward testing the $0.1670 level or higher.
Conversely, if bearish conditions surface across the ARB ecosystem, the valuation could quickly retreat to support at $0.1482. A deeper downward correction might spark a death cross, pushing prices toward a trough situated beneath $0.14.
Is Arbitrum’s Technical Setup Pointing to More Uptrend?
An evaluation of Arbitrum’s technical indicators reveals that the Moving Average Convergence Divergence (MACD) line rests above the zero line, whereas the signal line remains beneath zero. This configuration highlights a shift from an earlier bearish phase into a developing upward trend.
Positive long-term momentum is now established. The signal line lingering below zero points to historical weakness that has yet to completely level out. Market participants interpret this setup as an early bullish indicator, demonstrating that a solid uptrend is forming and working to lift the broader trend out of negative territory.
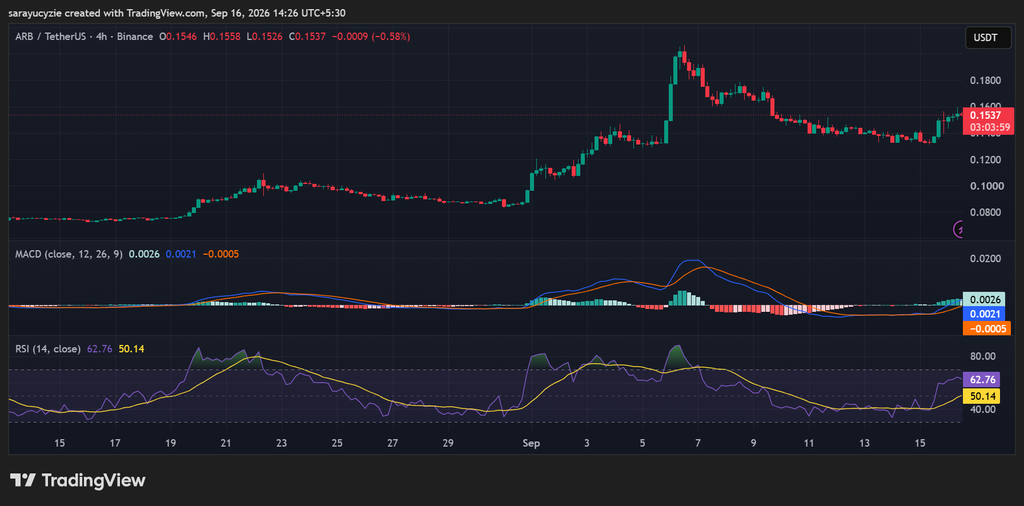
Market sentiment for Arbitrum currently resides in a moderately bullish state, backed by a daily Relative Strength Index (RSI) reading of 62.76. This metric indicates that purchasing activity outweighs selling pressure, though the asset has not yet entered overbought conditions.
This region displays steady, constructive upward drive absent of immediate fatigue. Traders typically view readings in this zone as evidence of healthy market resilience, signaling that buyers maintain dominance and leaving adequate space for further appreciation before momentum stretches too thin.
Crypto Market Highlights
Confidential Robinhood Data Allegedly Fueled Hyperliquid Trades: Two Engineers Charged
Frequently Asked Questions
What is the current trading price and daily gain for Arbitrum (ARB)?
As of Sept. 16, Arbitrum is trading at approximately $0.1547, reflecting a gain of over 16.2% with a trading volume of $530.9 million.
What is Standard Chartered’s long-term price prediction for ARB?
Standard Chartered has issued a price target of $10 for Arbitrum by the end of 2030.
What do the technical indicators suggest about ARB’s market momentum?
The MACD indicates a transition from a prior downtrend to an emerging uptrend, while the daily RSI sits at 62.76, reflecting healthy, moderately bullish buying pressure without being overbought.
