


- Ethereum (ETH) is currently trading within the $2.5K mark.
- The price range now corresponds directly to a prior accumulation zone.
Ethereum (ETH), the leading altcoin, changes hands around $2,503—marking a 1.1% decline alongside $9.84 billion in volume. Over the past 24 hours, liquidations reached $21.13 million. Daily trading has spanned a $2,487 to $2,535 corridor, while the weekly span covers $2,409 to $2,621.
After slipping near $2,410, prices quickly rebounded past $2,500, demonstrating that buyers remain active at reduced prices. Even so, ETH trades below the $2,530–$2,550 resistance band, which has not yet been broken.
An accumulation behavior mirroring past market cycle lows is emerging at present valuations. The zone where ETH currently trades directly matches a previous accumulation area.
Furthermore, ETH is positioned squarely at its Weekly 200MA/EMA, a threshold drawing strong interest from both buyers and sellers. This dynamic establishes the current area as one of the chart’s most vital technical boundaries.
ETH’s Key Levels and Technical Indicators
Maintaining $2,500 opens the door for another upward push. Failing to hold $2,450 likely brings a retest of the $2,410 wick, with wider support resting between $2,400 and $2,450. Dropping below this band paves the way toward $2,310. The $2,350 mark serves as the boundary preserving the ascending channel structure; letting it slip significantly undermines the recovery outlook.
Conversely, the $2,800 barrier stands between Ethereum and a potential run toward the $3,000–$4,000 zone for the first time in over nine months, though multiple resistance levels must be conquered first.
Positioning both the MACD line and the signal line beneath the zero line points to robust downward momentum. Sellers control the prevailing trend, with the shorter-term moving average tracking below the longer-term average.
Ethereum’s pricing reflects an ongoing downtrend rather than a brief correction. Typically, traders wait for the MACD line to reclaim positions above the signal line or the zero line before thinking about purchases.
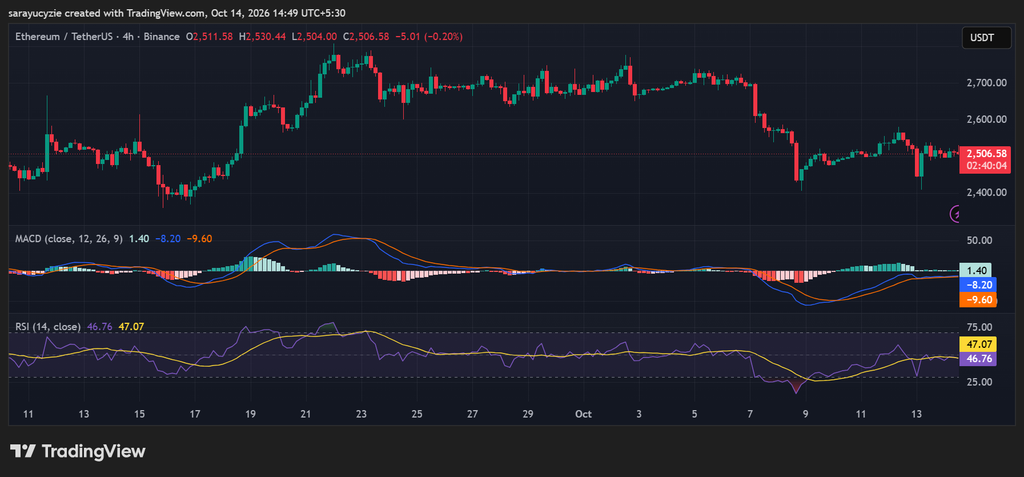
An RSI reading of 46.76 points to neutral-to-soft bearish market momentum. The cryptocurrency remains clear of overbought or oversold extremes, currently undergoing a consolidation phase lacking aggressive momentum.
With ETH lingering below the 50 midline, sellers maintain a mild advantage over buyers, though momentum lacks intensity. Market participants typically look for the index to push past 50 for bullish validation or drop near the 30 oversold marker prior to executing trades.
Crypto Market Highlights
Coins.ph Gambling Link Allegations Put Crypto Exchange License at Risk
Frequently Asked Questions
What is the current trading price of Ethereum (ETH)?
Ethereum is trading near the $2,503 mark, down by 1.1% with a 24-hour volume of $9.84 billion.
What are the critical support and resistance levels for ETH?
Broader support is found between $2,400 and $2,450, while immediate resistance sits in the $2,530–$2,550 range. Overcoming $2,800 is necessary for a potential push toward the $3,000–$4,000 region.
What do the technical indicators show about current market momentum?
The MACD lines resting below zero indicate strong bearish momentum and a sustained downtrend, while an RSI of 46.76 signals a neutral-to-weak consolidation phase.
